A short tutorial on using ProDebug
Here I show some of the features of ProDebug thru a tutorial.Plz note that these screenshots were obtained while running my code on bochs , a 386 emulator.
When you start up a screen like this comes up ....
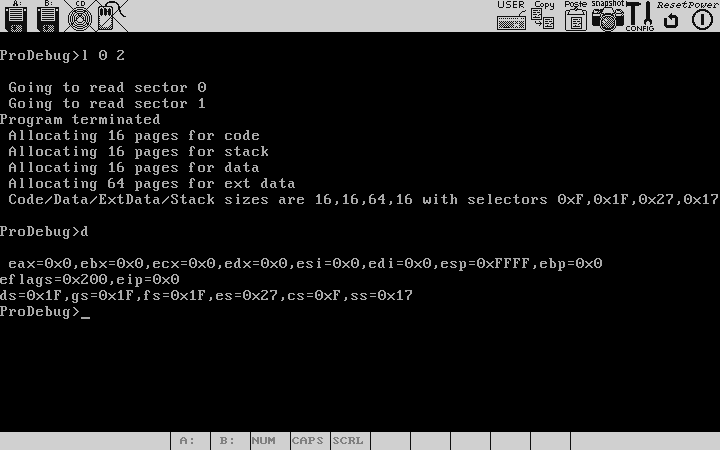
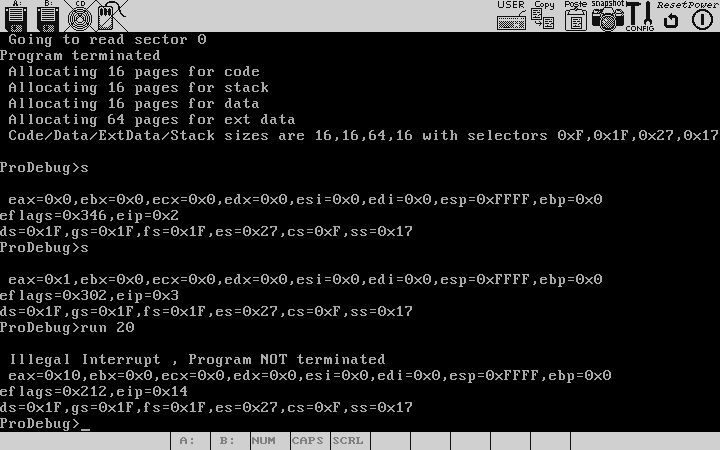
Lets start by loading a program , the program is only a few fifty or so bytes long ,it is just a series of 'inc ax' instructions(opcode 0x40). For sake of illustration lets load 2 sectors .The program on the floppy starts from the 0th byte on the disk .
To load it we say "l 0 2", The 1st argument to the l commnd is the starting sector,the 2nd argument is the num of sectors.We could also have specified in terms of absolute disk geometry : "l 0 0 1 2",which has the syntax l <headNo> <trackNo> <sectorNoOnTheTrack>,Plz note that the headNo ranges from 0 to 1, sectorNoOnTheTrack from 1 to 18, trackNo from 0 to 79.
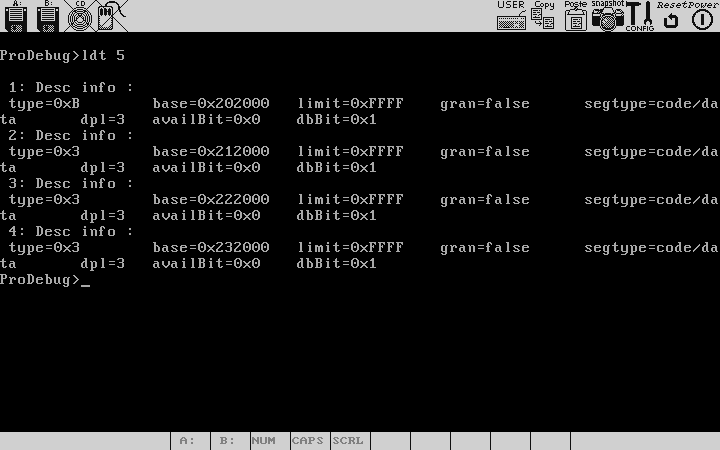
We next use the "d" command to see all the registers. Note that four segments have been allocated , code ,data ,stack each of size 64k or 16 pages(where each page is of size 4k bytes), and an extended data segment of 256k .All of these are stored in the LDT , you could check this by seeing the the 2nd bit from the left(starting from 0) is set to 1 , which means the segment descriptor is in LDT,if 0 it means it is in GDT.
Also Note that you can specify arguments in hex format like 0xf or in decimal like 15.
The user program memory is allocated in the LDT , the kernel memory and data structures are allocated in GDT.
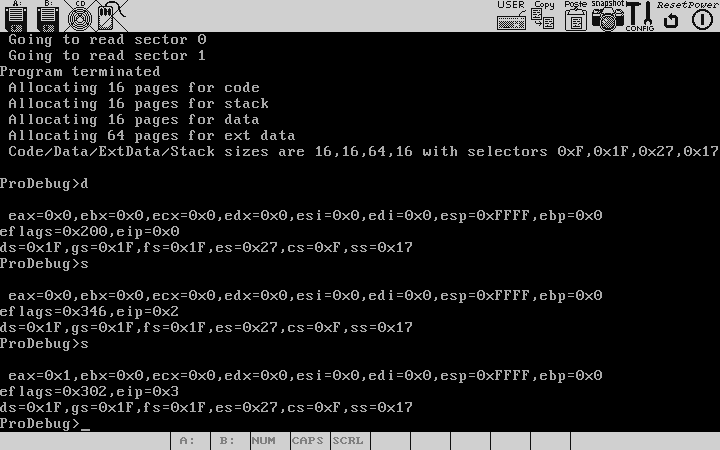
Lets step through this program , stepping through means to execute one instruction at a time.After executing an instruction , a register dump of the program is provided.The program being loaded is just a series of 'inc ax' , hence the eax keeps increasing.
We could also have done "s 3" to say that we want to step 3 instructions,ie execute the next three instructions ,before switching control back to the debugger.
Let's set few breakpoints,the "i" here signifies that we want to set an instruction breakpoint , ie the processor should break when the eip value equals the 2nd argument of the break command.
We can also specify data breakpoints in which the program breaks when a specific mem location is read or written to .For example to break a program when we read a mem location 0x2f:0x3 we say "brk r 0x2f:0x3" similarly for a write breakpoint "brk w 0x2f:0x3".
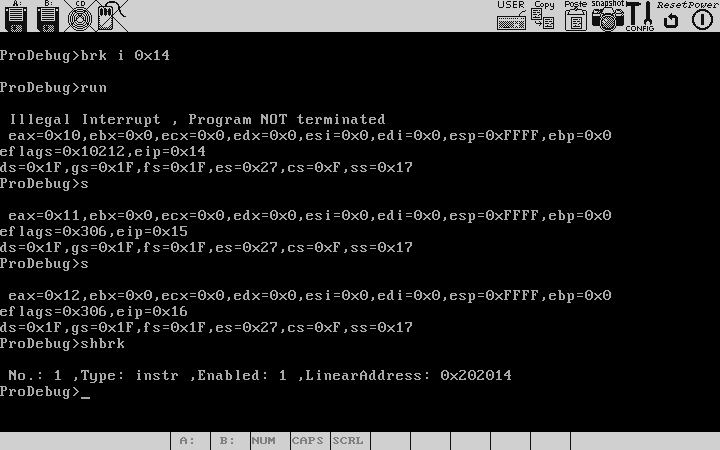
Let's try both stepping and running through a program. First we run into a suspected problem area,to do this we say "run 0x45" (Assuming you want to run till the instr starting at cs:0x45) .And then stepping through the program to home into the faulty instruction by examining the memory and register contents along the way.
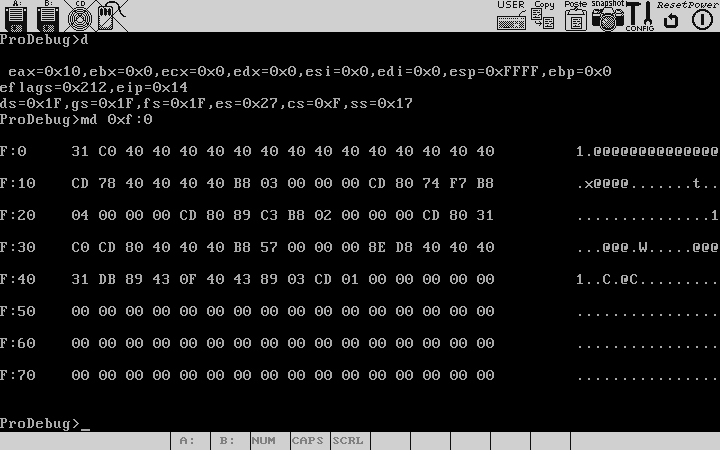
You can also inspect the system memory, to do that use the memdump command.Its syntax is md <segSel>:<Offset> [numBytes].If the numBytes is not specified a default 128 num of bytes is shown.What is shown here is a dump of the code segment.
This way you could also learn about the system by examining the gdt,ldt,tss etc of the program.The GDT begins at 0x1400 for 0x400 bytes , the LDT at 0x1800 and is for 0x200 bytes, the TSS of the program begins at 0x104000 for 0x1000 bytes(4k) .To access these you should use the kernel data segment 0x10,like 0x10:0x1400.Both the kernel code (0x8) and data segments are stored in the GDT
You can also copy from one memory location to a memory area that is writable by you (only your data segment and ext data segment are , the code segment isn't) by the command "mc 0x10:0x1400 0x3f:0x100 0x400" , where we copy the gdt into the data segment of the program (assumed to be 0x3f).
Here we play around with some of the misc features like inspecting the LDT of the program by the command ldt, similarly you can inspect the TSS,GDT,IDT. Please see the detailed command reference for more details .
There is also one command called called "crseg" by which you can create a read only selector in your LDT , this could be used for example used to map a read only area which you can inspect , example to map the kernel data segment "crseg 10 0x0 0xfffff" maps the first 1Mb of the kernel data segment into the selector 0x57 ( == ((selector Index<<3)|0x7)). This is because 10 is the selector index , whereas the last three bits are the {tableId,{2 bits for dpl}}. Since the user program runs at dpl 3 (the least priveleged one) , and is stored in the ldt(tableId 1) , the last three bits are made one after left shifting the index.
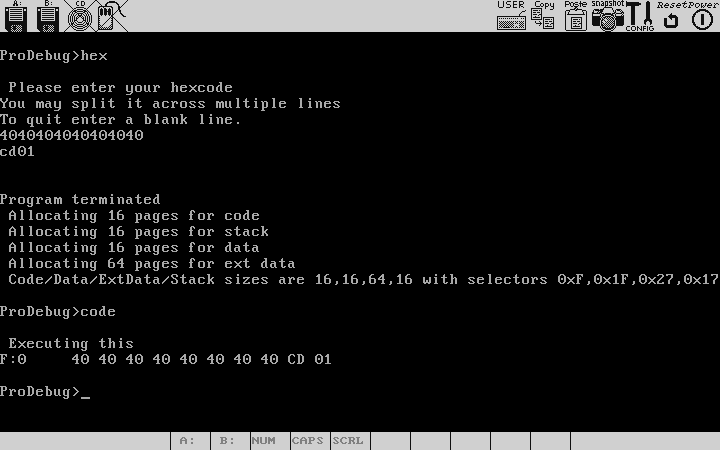
You can also enter in raw hex code , But plz note that the debugger can't spot any bugs in that , if the code you enter is not a valid 32 bit intel 386 code , your program will most probably fault by saying invalid opcode.Here we enter a small 7 byte hex code , which just increments ax ,opcode 0x40,a couple of times and then does a syscall exit .For the exit syscall , you put the syscall no in eax(0 for asm), and do a software interrupt of 0x80 , hence the code to that in asm is xor eax,eax,int 0x80 . Note that every program must be terminated by an int 1 ,or else if you run the proram all through, there is no way for the control to return to the debugger , although eventually when your eip goes right past your code segment boundary and throw a general protection fault , the control will return .